بهبود جامع - CQI360

بهبود کسب و کار - CQI360

بهبود جامع - CQI360

بهبود کسب و کار - CQI360

بهبود جامع - CQI360

This Blog Will Introduce Valuable Guide In C.Q.I, Strategy, Performance And Improve Business In Iran And The World
Hope To Improve.
Any Company In The World Can Have Free Introduce About Himself And His Product By Contact With Me
این وبلاگ قصد معرفی و آموزش نکات ارزشمند در حوزه بهبود و ارتقا کسب و کار در سازمان های ایرانی و خارجی را دارد.
باشد که تغییری حاصل شود.

طبقه بندی موضوعی
نویسندگان

۱۳ مطلب با موضوع «کلینیک مدیریتی» ثبت شده است

70 HR Metrics With Examples ( build your own dashboard )

·         HRtrics

70 HR Metrics With Examples

 Human Resources (HR) manages people — including hiring, on-boarding, performance, firing, off-boarding, benefits, development and compensation. But who manages HR?  

Executive oversight of HR is key to cost management, productivity, business development and competitiveness. Regular reporting of HR metrics is a good tool for managing any Human Resources department. 

Please download the followings great samples of HR Dashboard and Annual report  

1- Ms Excel Dashboard Example  

2- Annual Human Resources Full Report Example 

3- Extra Bonus :) HR tools in excel 

If you need help in the setting up the excel dashboard please send me a message on LinkedIn 

The following 70 HR metrics are illustrative. The metrics you choose should be closely aligned with your industry, business and strategy. 

HR Cost

1.    HR Cost per Employee
How much is the company spending on HR ? Example: HR cost per employee was $590. 

2. HR Cost vs Revenue 
HR cost was 0.54% of revenue.  

HR Responsiveness

1.    Average Response Time (ticket open with HR)
Employees open tickets with HR to ask questions, raise issues and provide feedback. How fast is HR's initial response? Example: average ticket response was 12.3 minutes.  

4. Average Resolution Time (ticket open with HR)
Average ticket resolution time was 34.5 hours. 

Issue Management

1.    HR Complaints by Category  
How many complaints were logged with HR? Complaint metrics are often broken down by category (e.g. harassment). Example: 12 complaints of harassment.  

6. Average Complain Resolution Time
How long does it take to resolve a complaint? Example: average complaint resolution time was 13 business days. 

7. Legal Costs 
Legal costs related to HR issues. Example: HR related legal costs were $45,459 for the quarter. 

8. Settlement Costs and Penalties  
Costs of fines and legal settlements related to HR issues. Example: HR related settlements and penalties totalled $1.2 million for the quarter. 

Recruiting

1.    Cost per Hire 
Costs per hire for recruiting, hiring and onboarding. Example: the average cost per hire was $22,127.  

10. Hiring Cycle Time  
Time from hiring requisition date to start date. Example: average hiring cycle time was 5.8 months. 

11. Hiring Fill Rate 
How many positions are filled after 6 months? Example: the 6 month hiring fill rate was 58%.  

12. Offer Acceptance Rate
How often does the preferred candidate accept the position? Often broken down by job level. Example: the offer acceptance rate was 55.5% for level 3 executives. 

13. Average Performance of New Hires
How well did new hires rate on their first performance review? Example: new hires scored an average of 3.6 (satisfactory) on their first performance reviews.

14. Voluntary Termination Rate in First Year 
How often do new staff quit? Example: the first year voluntary termination rate was 13.8%. 

15. Involuntary Termination Rate in First Year 
How often are new staff fired? Example: the first year involuntary termination rate was 8.2%. 

16. First Year Turnover Cost Rate 
Average costs related to workers who left in the first year including hiring costs, salary, training and benefits (it is often assumed that knowledge workers add little value in the first year). Example: average first year turnovers cost $90,398. 

17. Manager Satisfaction with New Hires 
Average manager satisfaction with new hires was 65.2%. 

18. Manager Satisfaction with Recruitment Process 
Average manager satisfaction with the recruitment process was 47.9%. 

19. Employees Recruited from Key Competitors 
In some industries employees that are recruited from key competitors tend to have higher productivity. Example: 131 employees were recruited from key competitors.  

Productivity

1.    Revenue per Employee
Revenue per employee was $402,398. 

21. Profit per Employee (PPE)
Profit per employee was $103,890 

22. Profit per People Dollar 
How much profit do you earn for $1 spent on employees and contractors. Example: profit per people dollar was $0.56. 

23. Average Days Absent 
Average days absent was 13.4 days. 

24. Business Specific Productivity Metrics 
Productivity should be measured in terms that are relevant to your business. Call center example: call volume per employee increased 4% to 17.5 calls per hour. 

25. Salary Increase vs. Revenue Increase 
When your spend more on employees is there payback? Example: average salary increased at 4.2% while revenue increased at 3.2%. 

Performance Management

1.    Average Performance Rating 
How well did employees score in performance reviews? Example: average performance rating was 3.8 (high satisfactory). 

27. Problem Employee Rate
How many employees failed performance reviews? Example: the problem employee rate was 4.5%. 

28. Rehabilitation Rate for Problem Employees
How many problem employees are rehabilitated within 6 months? Example: 57% of problem employees are rehabilitated. 

29. Termination Rate for Problem Employees 
How many problem employees are terminated? Example: 22% of problem employees were terminated. 

30. Average Cost to Terminate Employee 
How much does it cost to fire someone (including legal, administration and severance)? Example: the average cost to terminate an employee was $33,090. 

Costs

1.    Average Salary 
Often broken down by job level, department or position. Example: the average salary for a level 3 executive was $214,000. 

32. Salary Deviation (by job level)
What is the range between the top and bottom pay for a job level? Example: the salary deviation for a level 3 executive was $109,876. 

33. Cost of Benefits as a Percentage of Salary
How much are you spending on benefits relative to salary? Example: average cost of benefits was 39.7% of salary. 

34. Cost of Benefits as a Percentage of Revenue 
Average cost of benefits was 3.7% of revenue. 

Key Employees and Star Performers

1.    Key Employee Satisfaction Rate
How satisfied are your most important employees? Key employees often includes executives and top performers. Example: key employees had a satisfaction rate of 89.7%. 

36. Key Employee Retention Rate
The retention rate for key employees was 82.3%. 

37. Key Employee Cost Rate 
How much do key employees cost (including salary, benefits, training and incentives)? Example: the average cost for a level 3 key employee was $405,098. 

38. Key Employees Eligible for Retirement 
How many key employees are eligible for retirement in the next 5 years? Example: 15.8% of key employees are eligible for retirement in the next five years. 

39. Bench Strength 
A succession planning metric that measures the depth of the successor pool for a key position. Example: there are 14 qualified successors for level 1 executives. 

40. Key Employee Turnover by Reason Code 
Why do key employees leave? Reason codes include things like compensation, personal reasons, benefits, professional development etc... Example: 17% of key employees leave for better compensation. 

HR Pipeline

1.    Employee Salary by Level
Average salary broken down by level. Example: average salary for level 8 staff is $48,765. 

42. Number of Employees by Band
There are 10,876 level 8 staff. 

43. Employee Productivity by Position 
This is a business specific metric. Biomedical research example: the average patents per senior researcher was 0.16. 

44. Attrition by Level 
The attrition rate for level 8 staff was 17.3%. 

Employee Retention

1.    Involuntary Termination Rate
The involuntary termination rate was 2.2%. 

46. Voluntary Termination Rate 
The voluntary termination rate was 21.1%. 

47. Average Retention Period 
Often broken down by department, manager or position. Example: the average retention period in the sales department was 3.4 years. 

48. Employees Eligible for Retirement 
28% of employees become eligible for retirement in the next 5 years. 

49. Employees Eligible for Early Retirement 
Not all employees eligible for early retirement will retire — there is often room to negotiate. Example: 30.2% of employees are eligible for early retirement in the next 10 years. 

50. Average Tenure 
Average tenure is 13.6 years. 

51. Voluntary Termination By Reason Code 
Why are staff leaving? Example: 8% of staff who quit said it was because of working conditions. 

Employee Satisfaction

1.    Job Satisfaction
Average employee job satisfaction was 67%. 

53. Job Empowerment
76% of employees say they are empowered to do their jobs. 

54. Compensation Satisfaction 
3% of employees say they are satisfied with compensation. 

55. Opportunities for Advancement 
43% of employee say they have opportunities for advancement. 

56. Training and Development Effectiveness 
33% of employees say that training and development programs are effective. 

57. Net Promoter Rate 
65% of employees say they would recommend our products to friends and family. 

58. HR Department Satisfaction Rate 
34% of employees are satisfied with the HR department. 

59. Management Effectiveness 
16% of employees are satisfied with executive management. 

60. Clarity of Company Vision 
38% of employees believe the company has a clear vision. 

61. Equal Opportunities 
89% of employees say there are equal opportunities for advancement. 

62. Work / Life Balance 
44% of employees say they enjoy work / life balance. 

63. Employee Commitment Index 
Employees are asked questions that gauge their commitment to the company. Example: 16% of employees say they will remain at the company for more than 5 years. 

64. Market Opportunity Index 
Employee perceptions of opportunities elsewhere. Example: 67% of employees believe our competitors offer higher compensation. 

65. Employee Complaints 
2.1% of employees made at least one complaint to HR. 

66. Employee Lawsuits 
6 employees and former employees sued the company. 

Training and Development

1.    Training Cost per Employee
Average training and development costs were $3,454 per employee. 

68. Training per Employee
The average employee completed 14.7 hours of training. 

Diversity and Compliance

Employers track diversity statistics for regulation and compliance. 

69. Gender 
Example: 54% of level 3 executives are women. 

70. Disabilities 
Example: 6.3% of employees have a disability.  

Hope you find this useful 

Thank you ,  

Issam K. Assaf  

Business Consultant 


  • amir ahmadi

HR Annual report

  • amir ahmadi

move

  • amir ahmadi
اون خدمتکاره تو کارتون تام و جری کی بود؟!!!

صرفا جهت ارضا حس کنجکاوی میگم. قطعا شما هم این کارتون جذاب و با مزه رو دیدن. داستان سر به سر گذاشتن های موش و گربه ی قصه که گاهی وقت ها با تنبیه خدمتکار خانه همراه می شود. اما تا حالا کنجکاو نشده بودین تا بفهمین این خدمتکار که صورتش هم تو کارتون مشخص نیست کی بود؟ از کی الگو برداری شده بود؟ دقت کرده بودین که سیاه پوست بود؟ بعدها حتی این کارتون به نژاد پرستی هم متهم شد. اما خدمتکار خونه از کی الگو برداری شده بود؟

به گزارش سامانه دانشجویان ایران: مطمئنا همه ما در هر سنی که باشیم کارتون تام و جری رو دیدیم. موش و گربه‌ای دوست داشتنی که هنوز هم دیدن شیطنت ها و تعقیب و گریزشون برای ما جذاب است.

اما نکته ی مبهم در این کارتون مشخص نبودن چهره ی زنی بود که ظاهرا خدمتکار خانه ای بود که تام و جری در آن زندگی می کردند و گاهی با جارو به خدمت این موش و گربه ی شیطون می رسید، البته گاهی خودش هم قربانی دعوای تام و جری می شد. شاید این زن تنها کسی بود که تام و جری هردو ازش می ترسیدن وقتی با جاروش وارد میشد، مطمئن بودیم حساب تام یا جری رو میرسه.

زنی که همه‌ی کودکان طرفدار کارتون تام و جری در آرزو دیدن چهره‌اش بودند، خانم “هاتی مک دنیل” بود که کاراکتر او را به شخصیت کارتونی تبدیل کرده بودند. هاتی خودش پیشنهاد داده بود که برای برانگیختن حس کنجکاوی کودکان، چهره‌اش در این کارتون نمایش داده نشود.

اما قصه به اینجا ختم نمیشه. در اصل ایشون اولین بازیگر سیاه پوستی بودند که برنده جایزه اسکار شدند، اون هم تو فیلمی که یک شاهکار به تمام معنا بود، «بر باد رفته». جالب اینکه در این فیلم هم نقش خدمتکار رو بازی کردند.
مک دانیل در آن سال با احترام و همراه با اسکورت برای دریافت جایزه خود وارد هتلی شد که ورود سیاه پوستان پیش از آن به آن هتل ممنوع بود.
بعد از اینکه این طلسم شکسته شد ۱۳ سیاه پوست دیگر هم موفق به دریافت اسکار شدند. دنزل واشنگتن، کوبا گودینگ، لوئیس گاست، فارست ویتاکر، سیدنی پویتیر، جیمی فاکس، مورگان فریمن، هالی بری، ووپی گلدبرگ، جنیفر هادسون، اوکتاویو اسپنسر، مونیک نیونگو و لوپیتا نیونگو.
مک دانیل در سن ۵۷ سالگی به خاطر ابتلا به سرطان از دنیا رفت.
او هنگام دریافت جایزه خود در حالی که اشک می ریخت گفت: این شادترین و بهترین لحظه زندگی من است. از آنهایی که مرا انتخاب کردند به خاط مهربانیشان ممنونم. امیدوارم همیشه بتوانم باعث افتخار نژادم باشم.

هاتی مک دانیل

هاتی مک دانیل

هاتی مک دانیل و اسکار

هاتی مک دانیل و اسکار

مک دانیل در فیلم بر باد رفته

مک دانیل در فیلم بر باد رفته

  • amir ahmadi

شاتنا: مدیرعامل شرکت پالایش نفت بندرعباس از ساخت و تامین بیش از ۵٨ میلیارد ریال از اقلام این شرکت از سوی سازندگان داخلی خبرداد.
هاشم نامور گفت: پالایشگاه بندرعباس، پارسال در راستای حمایت از توان و تولید داخل بیش از ۵٨ میلیارد ریال از اقلام و تجهیزات مورد نیاز خود را از سازندگان داخلی تامین کرد.
وی افزود: بخشی از تجهیزات و اقلام مورد نیاز پالایشگاه بندرعباس همسو با اجرای سیاستهای کشور مبنی بر حفظ منابع و صیانت از سرمایه‌های ملی و در مسیر تحقق سیاستهای اقتصاد مقاومتی از سوی سازندگان داخلی ساخته شد.
مدیرعامل شرکت پالایش نفت بندرعباس ادامه داد: پارسال، ٢٣٩ قلم کالا در قالب ٧١ تقاضا و در مجموع به تعداد ٢٠ هزار و ۶۴٠ کالا به ارزش ۵٨ میلیارد و ٧۶٠ میلیون ریال از اقلام مورد نیاز پالایشگاه از طریق سازندگان داخلی تامین شد.
وی تاکید کرد: در همه مراحل ساخت کالاها، کیفیت تولید و ساخت به وسیله کارشناسان و متخصصان پالایشگاه مورد ارزیابی و تایید قرار گرفته است.
نامور اعلام‌ کرد: قطعات و کالاهای ساخت داخل، پارسال شامل اقلام و تجهیزات مهم صنعتی از جمله قطعات ژنراتورها، الکتروپمپها، لوازم آزمایشگاهی و برخی قطعات کاربردی در فرآیند پالایش بود.
وی افزود: با برنامه‌ریزیهای اصولی و اعمال نظارت و کنترل در خرید و حمایت از توان و تولید داخلی به منظور حمایت از سیاستهای خود اتکایی و قطع وابستگی به کشورهای خارجی که منجر به انتقال فناوری، اشتغالزایی و صرفه جویی ارزی برای کشور می‌شود اقدامهای موثر و قابل توجهی در شرکت پالایش نفت بندرعباس انجام شده است.
مدیرعامل پالایشگاه بندرعباس، اقدامهای انجام شده همسو با آرمانهای اقتصاد مقاومتی و حمایت از تولیدات داخلی را اجرای طرحهای خلاقانه برای رفع موانع تولید و ارتقای فرآیندها، کاهش هزینه‌های تولید از طریق تکیه بر توانمندی کارشناسان پالایشگاه و سازندگان داخلی، جلوگیری از خروج ارز، انتقال و بومی‌سازی فناوریهای روز دنیا اعلام کرد.
شرکت پالایش نفت بندرعباس با ظرفیت پالایش روزانه ٣۵٠ هزار بشکه نفت خام سنگین و میعانات گازی، سومین پالایشگاه کشور پس از پالایشگاههای آبادان و اصفهان از نظر ظرفیت است و ١٨ درصد فرآورده‌های نفتی مورد نیاز کشور را تامین می‌کند.

  • amir ahmadi

I travel frequently from my home in Perth, Western Australia. That makes every flight a long flight and it gives me plenty of time to think -- and sometimes even about the flight itself (particularly those long evening journeys home that seem to take forever).

I've learned a few life lessons in all those flying hours:

1. You don't always get the best seat. It's amazing how you can come to expect a certain seat, or row, and get a little narky when it doesn't quite always work out.

Lesson: Sometimes life isn't fair. Sometimes it's someone else's turn.

2. You don't own the seat next to you -- unless you bought it. I remember once on an 8 hour flight from Perth to Hong Kong that I thought had a spare seat next to me. At the very last minute, literally seconds before the main door was closed, a man boarded and suddenly my spare seat was gone. My spare seat? Excuse me? I didn't buy it and yet felt more and more entitled to it the longer it remained free. At least an hour into the flight, probably longer, my attitude to this innocent stranger beside me softened. It wasn't his fault my expectation built the way it did. His only contribution to my false expectation was being last aboard.

Lesson: Know what is yours and what's not.

3. Every trip is different. I take certain flights a lot. Same time of day. Same aircraft type, occasionally same pilot (I like to remember their names), same route, much the same duration. But here's the thing, while some things are the same, the most important part is actually different. There's a unique collection of individuals who will never, ever be together again in this combination. Ever. And that means the dynamic is actually very different each time, even though we are conditioned to thinking it's the same.

Lesson: Even though life appears to be the same it's mostly not. People make the difference.

4. Everyone else has needs. Back to my seat allocations. I like to get my seat preference as do most people. And like I say I'm happier when I do. I don't want you to think I'm a saint but occasionally I've given up my extra legroom seat for a traveller with an obvious need greater than mine. I've seen others do it too. It feels good to do it and surprisingly the sacrifice made is barely noticed but the gesture is always appreciated. 

Lesson: Be aware and respond to the needs of others.

5. We only remember the really good or really bad flights. Whenever we talk about flying you'll notice only the extremes are discussed. That amazing upgrade to first class, the 20 hour delay, the time you met a new friend, or quite unplanned got to sit with an old friend, or when you were projectile vomited on by a baby that screamed the whole flight (when it wasn't projectile vomiting). So when you're having a hellish time or living in the lap of luxury, remember your next dinner party story is writing itself!

Lesson: A life worth sharing is usually a life lived in the extremes.

  • amir ahmadi

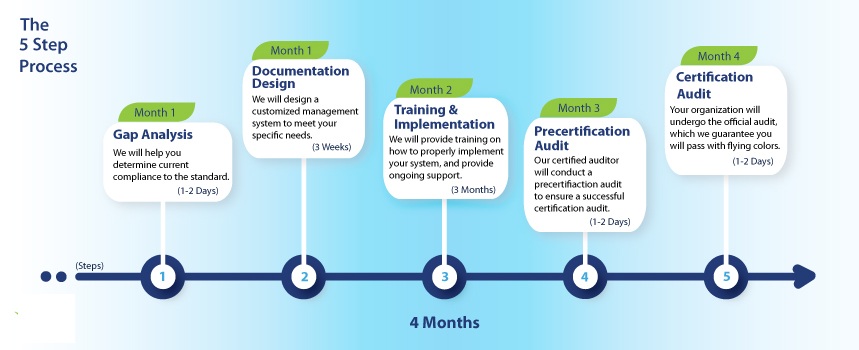
iso 14001:2015

iso 14001 steps

  • amir ahmadi

جَک وِلش،  مدیرکل انستیتوی مدیریت در دانشگاه اِسترِیِر در ایالات متحده آمریکا  و برگزارکننده برنامه ام بی ای آنلاین،است. انستیتوی مدیریت جک ولش به دانش پژوهان و سازمان ها متودولوژی های اثبات شده را آموزش می دهد، آموزش هایی که بلافاصله پس از فراگیری، در عمل قابل استفاده هستند و توانایی هایی در اختیار در دانشجو قرار می دهند که لازمه پیشرفت در کسب و کار است.
پیشرفت در کسب و کار به ندرت از طریقی هموار و آسان حاصل می شود. اگر در مسیر پیشرفت خود با چالش هایی مواجه شده اید – و بیشتر ما در مقطعی از زمان این نوع مشکلات را داریم – نگاهی به خود در آینه بیندازید.
سر بحث را با شما در مورد ده نوع الگوی رفتاری بسیار رایج باز می کنم. آیا شما مرتکب این نوع اشتباهات رفتاری می شوید؟ این نوع رفتار ها پیشرفت شما را کاملا مختل می کند.
اگر شناختی از رفتارهای خود داشته باشید، به نحوی مصمم در خود تغییر رفتاری ایجاد نمایید – قبل ار اینکه دیگران شما را مجبور کنند. اگر زمان را ازدست ندهید، کسب و کار و پیشرفت شما مجددا سیر صعودی را طی خواهد نمود:
دست نیافتن به هدف یا ارزش ها- تعدد در اهداف و نتیجتا کارآیی پایین
مقاومت در مقابل تغییر – عدم توانایی پذیرش ایده های جدید
توان تشخیص مشکلات ولی عدم حل مشکلات.
مدیر خود را متقاعد کردن ولی عدم توانایی در مجاب کردن نظرات گروه خودتان.
همیشه نگران پیشرفت کاری در مرحله بعدی بودن بجای اینکه بر روی کار فعلی خود تمرکز نمایید
در پی مقام بودن- همه این را می بینند به غیر از شما
از خود راضی بودن – نمایش رفتاری خشک و بی روح.
جرأت نداشتن برای تغییر در سیستم
به فراموشی سپردن جانشین خود زمانی که ارتقاء شغلی پیدا کرده اید.
خود پسندی- در این حالت پیشرفت شما به سکون رسیده است 

  • amir ahmadi

آغاز

سلام

مدیران زیادی هستند که کسب و کار خودشان را راه اندازی کرده اند ( و چه بهتر قبل از راه اندازی رجوع شود) و اکنون مشکلات زیادی گریبان گیر آنان شده است و نمیدانند چه کنند:

- کارکنان کار خود را به درستی انجام نمیدهند.

- مدیران با هم تعامل ندارند.

- نمیتوانیم مشخص کنیم چه کسی جه کار میکند و معیار ارزیابی نداریم.

- برای توسعه کسب و کار نمیدانیم جه کنیم.

- اصلا مدیر عامل باید چه کند؟

و....

بنده در زمینه بهبود مستمر در کسب و کار از طریق ابزار و مفاهیم دنیای مدیریت نوین و با کمک :

- سیستم های مدیریتی(ISO)

-  مدل های تعالی(EFQM)

-  استراتژی 

-  ارزیابی عملکرد فعالیت دارم.

و میتوانیم با کمک هم کسب و کار شما را بهبود دهیم

با تشکر.

برای کسب اطلاعات بیشتر به " خدمات مشاوره" و جهت اطلاعات تماس در " تماس با من" مراجعه بفرمایید.


  • amir ahmadi

The list of the Lean Tools.


After you have studied Lean Manufacturing Theory
it could be useful to have a list of the tools 
(and methods) you can use.


Can you fix a screw with an hammer?

In the same way it important to use
the proper Lean method (or tool)
to fix a particular source of waste.

If you have the list always on your desk,
you can easily chose the right Lean tool.

Here the list we suggest to Cut, Paste and Print.

1.  5S
2.  Error Proofing (Pokayoke)
3.  JIT (Just in Time)
4.  Kaizen
5.  Kanban
6.  Pull system
7.  Work Levelling (Heijunka)
8.  Cells
9.  Set-up TIme Reduction (SMED)
10.  TAKT Time
11.  TOC – Theory of Constraints
12.  VSM – Value Stream Mapping
13.  TPM – Total Productive Maintenance
14.  Visual Management
15.  5 why's analysis
16.  Six Sigma

  • amir ahmadi